Thursday, December 12, 2013

Top Maps Extra Credit

Student-Made
Kara's Government Shutdown map not only looks beautiful (the fonts are so crisp and modern, I love it), but it's got some bitter sass to it. The first time this was shown in class, I almost spat coffee out my nose.

The cartoon heads are so clever and well done. Great way to show a pretty simple concept in a way that's new and fun.

Jon and I had a secret rivalry that only I knew about all semester because of how jealous I was of this map -- he's got a great sense of design and all his maps this semester looked great, the alpaca symbol here not only hammers home a point but looks adorable.

The smerg maps were probably my favorite lab all semester -- they're all so silly and cute. I'm still baffled by the inclusion of Gizmo on this one, and I'm still even more baffled by how great Gizmo looks in the corner there. Creative and clever.
The frayed border to the weird ripped paper texture on the counties, this map just makes me smile.

Weekly Post Maps
I can't for the life of me discern what this is without reading about it, but I could look at it for hours. Great find, Kara.

The colors are so bright and pretty but not super hard to understand -- the shape of Antartica is something that's so easily forgotten, this map does a great job of displaying the importance of projections.
This map upsets me as a result of how cool it looks. The feel of surging electricity just resonates through the whole page when you look at it.
Rebecca and I are officially feuding. Why didn't you show me this? I love the look of it, although I resent the need to explain bigfoot away with facts and such. Let the believers believe, it's good for them. Probably.
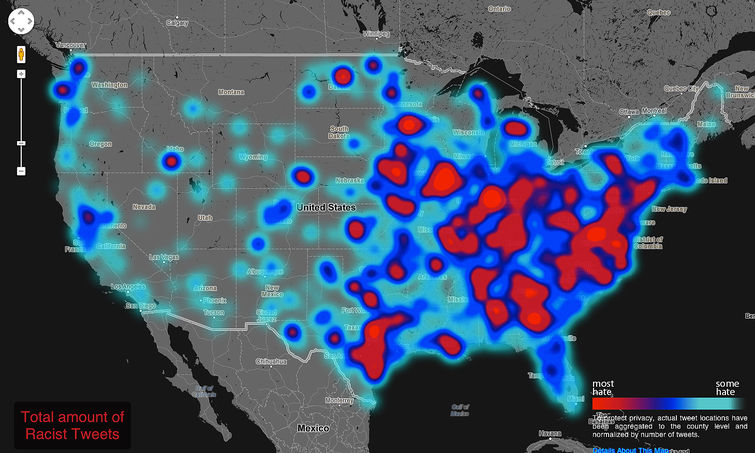
I love love love maps that show spatial trends to data that people wouldn't think of as spatially related (usually internet based.) It's such a good idea, and executed perfectly.

Tuesday, November 19, 2013

Lab 10

The gradient exported kind of strangely, but I think I actually like the weird lines more.

Monday, November 11, 2013

Lab 9


Can't decide whether I hate myself for using this color scheme, but I thought it'd be kind of cute and this map doesn't seem too serious.

Wednesday, November 6, 2013

Final Project Proposal


I'm a geography major, and the reason I got into geography was because as a child, I was into maps. As a child, I was into maps for the same reason I was into books -- because cool, impossible things seemed to happen a lot in them. Specifically, monsters.
I guess I'm technically an adult and should probably be over this whole monsters/mythology phase, and by living in a world with Google Earth I've severally limited my ability to believe in hundreds of monsters currently haunting the world's oceans as depicted in the Carta Marina (the biggest influence on this project), I do have access to data collected by the BFRO (Bigfoot Field Research Organization), and I am planning to make an old-fashioned looking dot density map of reported bigfoot sightings in the US and Canada.

I realize that this map is pretty out there, and ultimately unhelpful in solving any global problems. However, this is a cartography class. My only other mapping classes have all been GIS based, and I want to get to fully explore the art that is map-making with this final project in a way that my other classes haven't offered.


Monday, October 28, 2013

Lab 8

Not overjoyed with how this one turned out, kind of had to rush it on the last day due to other classes.
The JPEG has a bunch of white space that I have no idea how to fix, which is weird.

Monday, October 21, 2013

Lab 7

Altering the size of the text in the legend might be a faux pas, I'm not sure, but I think it really adds a sense of weight to the map as well as filling up space in a way that I like.

Thursday, October 17, 2013

Lab 6

The color scheme is straight from colorbrewer and marked as "print-friendly" so it looks almost identical on-screen and off it, especially since I worked in CMYK to make sure that the colors would all mix well in ink instead of just on-screen. I have no problems with the way this looks printed versus on screen, although it looks slightly better on screen just because when you look closely at the printed map, you can see some slight printing errors where colors aren't 100% consistent for all of each state, but these are only visible when holding it right up to your face.

I really like the shade of blue that I used for the background, I'm going to have to make sure to file that CMYK number set away somewhere.

Tuesday, October 8, 2013

Lab 5


I like zoos. I was pleasantly surprised to see that the natural breaks looked a little better in my opinion.

Lab 4

The neatline is way too big, but this is how I turned it in and I'd rather not lie to you good people.

Tuesday, September 24, 2013

Lab 3

I used Calibri, was that right?

Typography Map

A map of Vancouver with all of the neighborhood labels forced into their geographic space. I wouldn't want to navigate with it, but it looks great. That font looks like it wants to give you a hug.

Source

Monday, September 16, 2013

Lab 2

I'm fairly happy with how this turned out, I think. I love Bauhaus 93 as a font, it's got a weird turn of the century art deco vibe to it.

Thursday, September 12, 2013

Projections example

This map was just taken from google maps/earth, but it highlights the same distance using two different projections in a way that shows the curvature of the earth very nicely.

I found it here.

Thursday, August 29, 2013

This was used for lectures at The University of Sheffield in the 1960s-70s. The black background really makes the dots pop (love proportional symbols!), and I love the way that the only color in the map is used to mark nuclear power, which seems as a result vaguely foreboding.


The map was found here